The company and program
| Client | A seed-stage dating app for relationship-minded daters in their late 20s and 30s, live in four US cities, free with a $24.99-a-month premium tier. |
| Stage | Seed |
| Industry | Dating apps |
| Timeline | One 90-day sprint, July 6 to October 4, 2026 |
| Channels | Onboarding and the profile builder, match-queue ranking, discovery settings, push notifications |
| Team | A Kiko growth lead plus agents: a cohort agent that split every metric by city and side of the market, a profile-quality agent that scored photo and prompt completeness, and an experiment write-up agent. The client's two engineers and its data scientist, who owned the ranking change, built the changes. |
The approach
- Hypothesis: new users quit when nothing happens in their first two days. Fuller profiles, early exposure to active users and wider defaults get them a match before they give up, without taking matches from existing users.
- Comparison: each change ran against a 50/50 split of new users for at least 14 days, read by city and by side of the market. The final read compares new users from June 22 to July 5 with August 17–30, after every winner was live.
- Decision rule: ship if first matches within 48 hours rise at least 3 points at 95% confidence, existing users' weekly matches fall no more than 5%, and reports per 1,000 matches don't rise. Kill it otherwise.
What we changed
- Weeks 1–2: where new users stall. Profiles with one photo got a quarter of the likes of profiles with three. New profiles waited behind existing ones in queues, and default ranges were set for the densest city.
- Weeks 3–4: test A, profile quality. Three photos to go live, chosen with a picker that suggested the clearest face shots, plus suggested prompts. First matches within 48 hours rose from 47.0% to 55.8%; a four-photo version was killed.
- Weeks 4–6: test C, city-density defaults. Default distance and age ranges were set per city from active-user density. Users receiving a like within 48 hours rose from 74% to 79%.
- Weeks 5–6: test B, new-profile exposure. New, complete profiles were shown to active, likely-compatible users for their first 48 hours, capped at 2 in every 10 profiles shown. First matches within 48 hours rose from 55.4% to 68.9%.
- Weeks 5–6: test D, AI icebreakers. Suggested first messages. Killed.
- Weeks 7–13: winners to 100%, the read and handover. Tests A, B and C went to all new users on August 17. We read 48-hour matches and day-7 retention for August 17–30 and handed over the city-level dashboard.
Every like and match came from real, active users. The app uses no seeded or bot profiles.
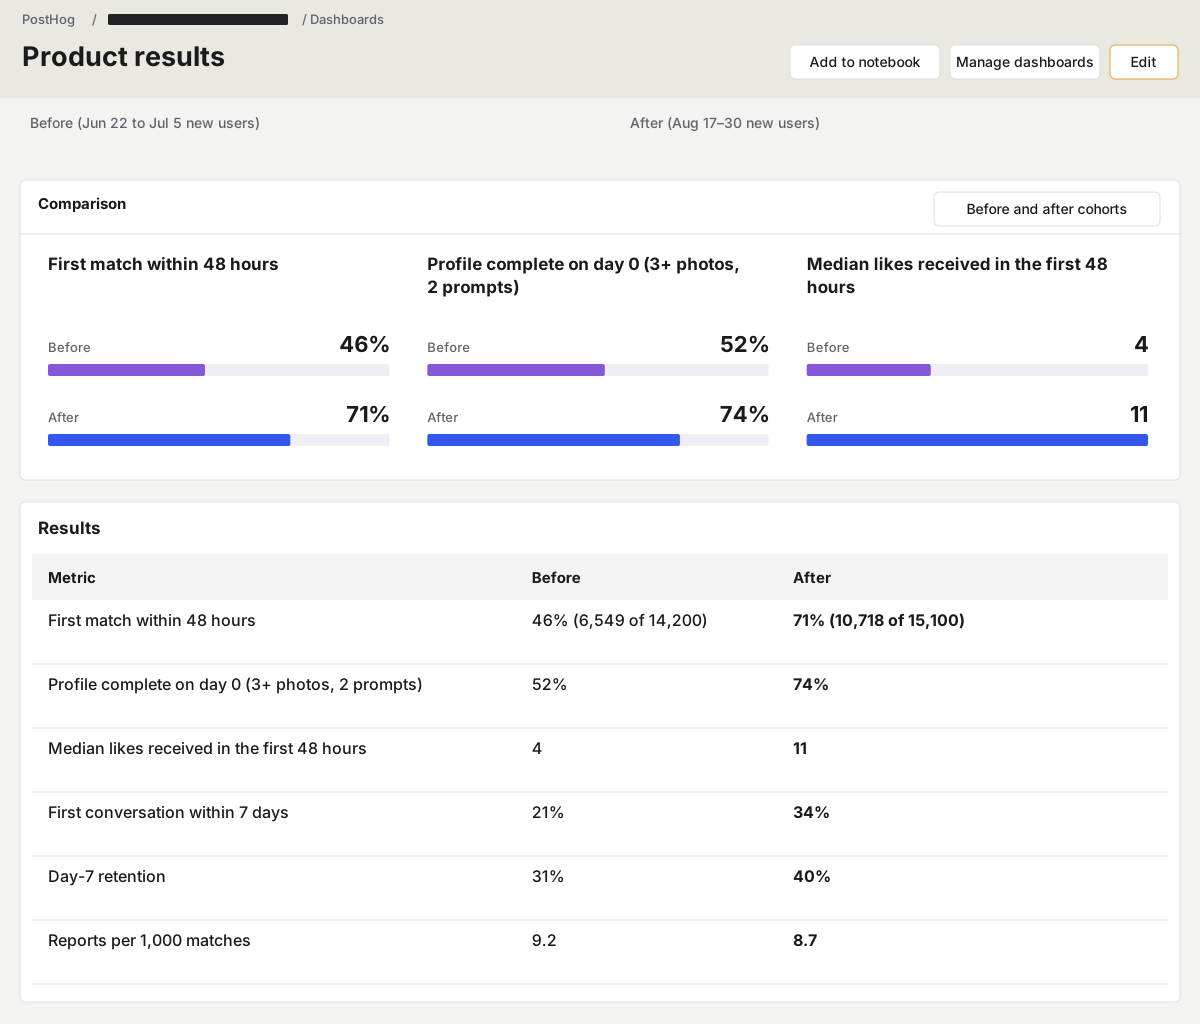
The results
| Metric | Before (Jun 22 to Jul 5 new users) | After (Aug 17–30 new users) | Change |
|---|---|---|---|
| First match within 48 hours | 46% (6,549 of 14,200) | 71% (10,718 of 15,100) | +25 pts |
| Profile complete on day 0 (3+ photos, 2 prompts) | 52% | 74% | +22 pts |
| Median likes received in the first 48 hours | 4 | 11 | 2.75x |
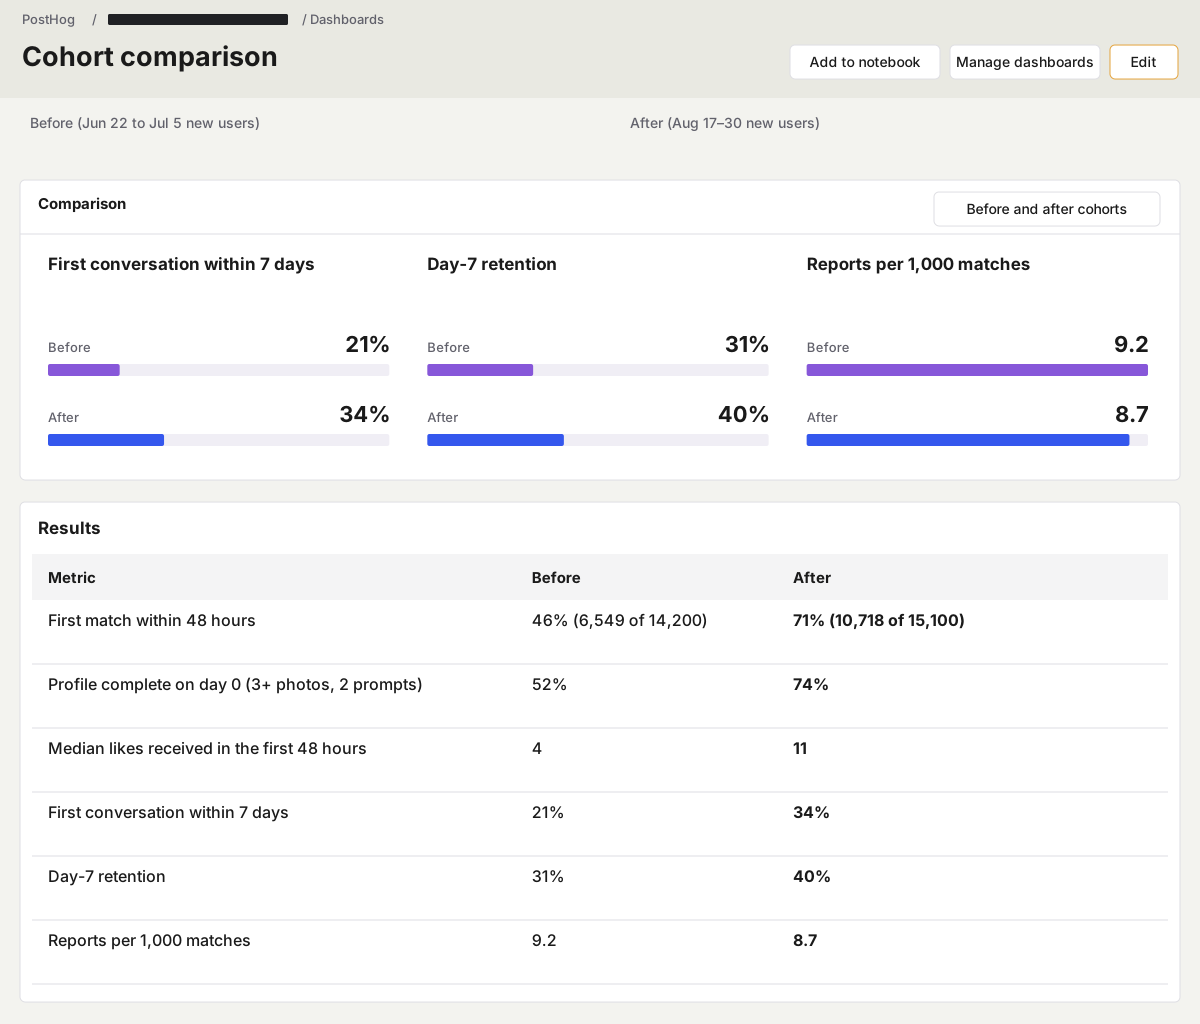
| First conversation within 7 days | 21% | 34% | +13 pts |
| Day-7 retention | 31% | 40% | +9 pts |
| Reports per 1,000 matches | 9.2 | 8.7 | −0.5 |
What didn't work
- The first version of new-profile exposure broke the guardrail. Uncapped, it cut existing users' weekly matches by 7% in its first week. Capping new profiles at 2 in every 10 shown brought that to −2% and kept most of the gain.
- A four-photo minimum. It cost 9 points of users going live on day 0. Three photos with a picker did better.
- AI icebreakers. First conversations within 7 days went from 31.8% to 32.3%, which was not significant. People who matched wanted to write their own first message.
What we learned
- Measure every change by city and by side of the market, not just in total.
- Set a guardrail for existing users before touching ranking.
- Fix profile quality before giving new profiles more exposure.
Frequently asked questions
How much does a dating app activation sprint with Kiko cost?
There was no creator or media spend, so the only cost was Kiko's 90-day sprint, priced from $10,000 a month. The client's two engineers and data scientist built the changes; Kiko ran the diagnosis, the five tests and the city-level reads.
How fast can a dating app raise its first-match rate?
Test A moved 48-hour matches from 47.0% to 55.8% within its first 14-day read in weeks 3–4. All three winners were live for every new user by August 17, week 7, and the final cohort was read by week 13.
Would this work for a Series A dating app with millions of users, or a friendship app?
The profile-quality floor and per-city defaults transfer at any scale. New-profile exposure gets harder as the base grows, because every slot for a new profile comes from an existing one. Keep the 2-in-10 cap and the 5% guardrail.
Related case studies and guides
Same industry, other angles:
- Creator marketing: 22,000 verified profiles in 8 weeks across Austin, Chicago and Denver
- Paid ads: Cost per matched user down 33% while spend doubled
- Full growth system: doubled weekly matches and grew subscription revenue 2.6x in 9 months