The company and program
| Client | A Series A dating app live in six US metros. |
| Stage | Series A |
| Industry | Dating apps |
| Timeline | 12 weeks, July to September 2026, against a 4-week baseline |
| Channels | Meta (with the client's written dating-ads permission), TikTok in-feed ads from the brand's account, Meta partnership ads with dating coaches |
| Team | A Kiko growth lead plus agents: a market-cell reporting agent that rebuilt the city-by-seeking-pair view every morning, and a creative-tagging agent |
The approach
- Hypothesis: cost per matched user falls if spend follows the short side of each market cell, even when those installs cost more.
- Comparison: 12 market cells (6 metros × 2 seeking pairs), each read weekly on matched users per dollar, against its own baseline. Creative concepts were compared on cost per matched user, not CPI.
- Decision rule: raise a cell 20% a week while its users wait more than 48 hours for a first match and the other side matches within 24. Hold while week-one matches per new user stay within ±10%. Cap or pause a cell when that figure drops 20% week over week.
What we changed
- Weeks 1–2: the event. We sent
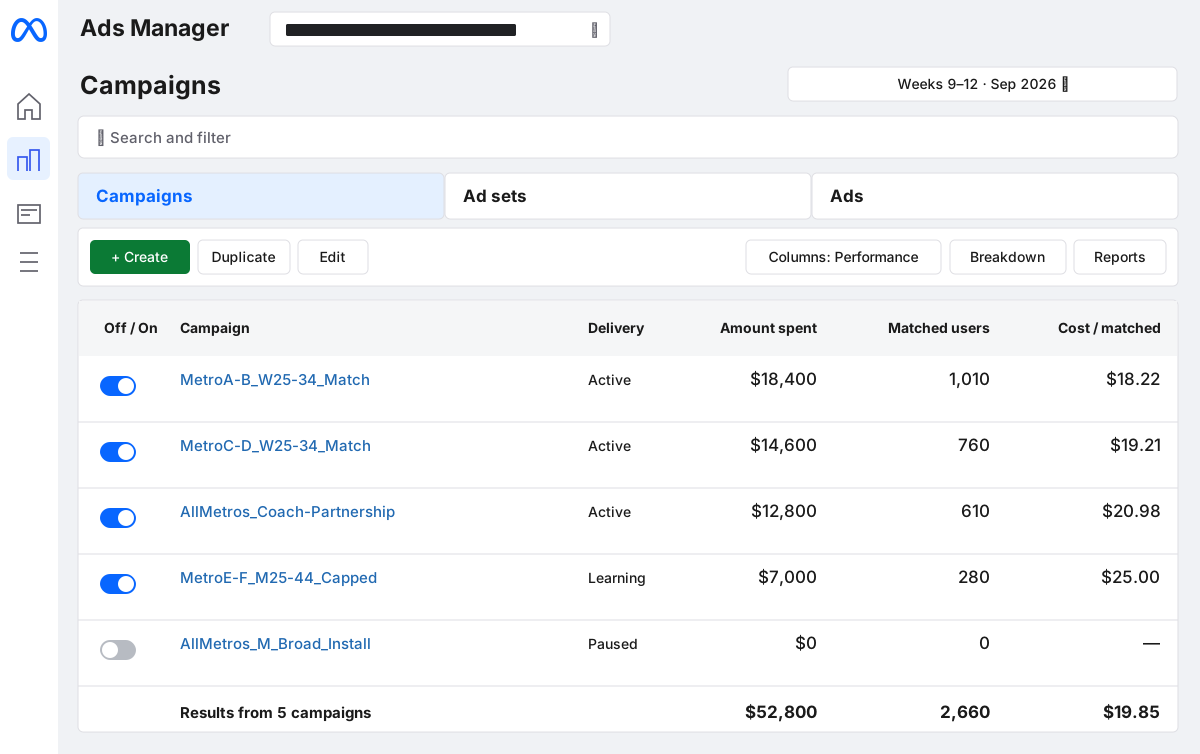
profile_completedandmutual_matchserver-side and rebuilt reporting by market cell. Campaigns moved from install optimization to profile completed. - Weeks 2–4: the cells. The short side, women 25–34 seeking men, showed in four of six metros. Men 25–44 seeking women was oversupplied in four metros, so we capped those cells and cut their budget 45%. A fifth cell was capped in week 7 after its week-one matches per new user fell 20%.
- Weeks 3–6: creative for the short side. Six dating coaches at 80K–300K followers made videos about dating with intent for Meta partnership ads. On TikTok, where branded creator posts for dating apps are barred, creator-style video ran from the brand's account. Each concept got $500–$1,000 or 7 days.
- Week 5: deeper event. Campaigns switched to optimizing for
mutual_matchonce each one cleared 50 a week. - Weeks 5–12: steps. Spend rose by up to 20% a week in the cells that met the rule, reaching double the baseline by week 9 and holding there through week 12.
The results
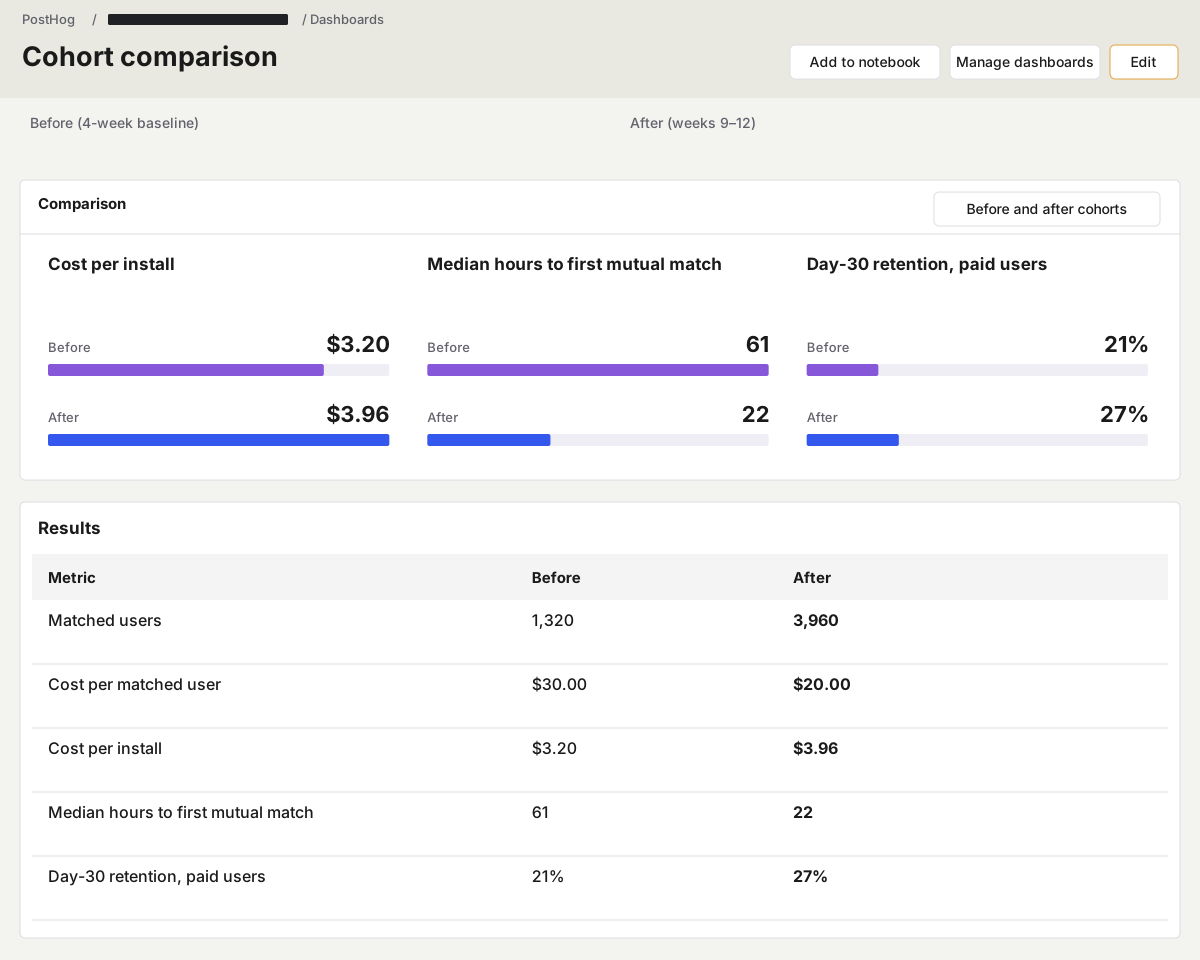
| Metric | Before (4-week baseline) | After (weeks 9–12) | Change |
|---|---|---|---|
| Matched users | 1,320 | 3,960 | 3.0x |
| Cost per matched user | $30.00 | $20.00 | −33% |
| Cost per install | $3.20 | $3.96 | +24% |
| Median hours to first mutual match | 61 | 22 | −64% |
| Day-30 retention, paid users | 21% | 27% | +6 pts |
What didn't work
- A "free and local" angle lost. It drew the cheapest installs of any concept and the worst match rate, because it pulled in the long side.
- Two metros never balanced. The short side stayed short in two cities even at higher budgets. Those cells needed product work on profile prompts, not more media.
- TikTok broad lagged. Broad TikTok cost $23.00 per matched user against $19.11 for the women 21–30 creator-style campaign, and it stayed in only as a reach floor.
What we learned
- Report every result by city and seeking pair from week one.
- Optimize to the match, not the install, as soon as the volume allows.
- Write creative for the short side and let the long side come organically.
Frequently asked questions
What did it cost to cut cost per matched user 33%?
Matched users ended at $20.00 each, down from $30.00, while media doubled and installs rose from $3.20 to $3.96. First conversations cost $27.78, down from $50.00. Most Series A programs like this run $60,000–$100,000 a month in creator fees and media.
How long does it take to shift a dating app from installs to matches?
12 weeks. Server-side events and market-cell reporting took weeks 1–2, cell caps went in by week 4, and campaigns switched to the mutual_match event in week 5. Spend reached double the baseline in week 9 and held through week 12.
Would this work for a seed-stage dating app in one city?
The short-side rule needs cells to compare; here, 6 metros by 2 seeking pairs. One city still gives two cells, so you can buy the short side, but the mutual_match switch needs 50 matches a week per campaign. Two metros here never balanced on media alone.
Related case studies and guides
Same industry, other angles: